
Page 63 - Microsoft Word - One-Report-Eng 2024 Final.docx
P. 63
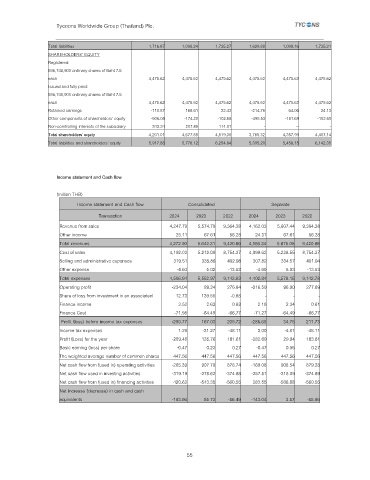
Tycoons Worldwide Group (Thailand) Plc.


                 Total liabilities                1,716.87   1,098.24   1,735.27   1,629.88    1,098.16  1,735.21
                 SHAREHOLDERS’ EQUITY
                 Registered:
                 596,748,900 ordinary shares of Baht 7.5
                 each                             4,475.62   4,475.62   4,475.62   4,475.62    4,475.62  4,475.62
                 Issued and fully paid:
                 596,748,900 ordinary shares of Baht 7.5
                 each                             4,475.62   4,475.62   4,475.62   4,475.62    4,475.62  4,475.62
                 Retained earnings                 -110.87    168.61      32.43     -214.76      64.06     34.13
                 Other components of shareholders’ equity   -506.08  -174.20  -102.68  -495.53  -181.69   -102.60
                 Non-comtrolling interests of the subsidiary   342.34  207.85  114.01   -          --         -
                 Total shareholders' equity       4,201.01   4,677.88   4,519.38   3,765.32    4,357.99  4,407.14
                 Total liabilities and shareholders' equity   5,917.88  5,776.12  6,254.64  5,395.20  5,456.15  6,142.35


                    Income statement and Cash flow

                    (million THB)
                           Income statement and Cash flow      Consolidated                Separate

                                  Transaction            2024     2023     2022    2024     2023     2022
                     Revenue from sales                  4,247.79  5,574.70  9,364.38  4,162.03  5,607.44  9,364.38
                     Other income                          25.11     67.61   56.28   24.31     67.61   56.28
                     Total revenues                      4,272.90  5.642.31  9,420.66  4,186.34  5.675.05  9,420.66
                     Cost of sales                       4,192.03  5.212.09  8,754.37  4,099.62  5.238.55  8,754.37
                     Selling and administrative expenses   319.51   335.86  402.98   307.82   334.57  401.94
                     Other expense                          -4.60    5.02    -13.53   -4.60     5.03   -13.53
                     Total expenses                      4,506.94  5,552.97  9,143.82  4,402.84  5,578.15  9,142.78
                     Operating profit                     -234.04    89.34  276.84  -216.50    96.90  277.89
                     Share of loss from investment in an associated   12.73  139.55  -0.98  -     -       -
                     Finance income                         2.52     2.63     0.62    2.18      2.34    0.61
                     Finance Cost                          -71.98   -64.49   -66.77  -71.27   -64.49   -66.77
                      Profit (loss) before income tax expenses   -290.77  167.03  209.72  -285.60  34.75  211.73
                     Income tax expenses                    1.29    -31.27   -48.11   3.00     -4.81   -48.11
                     Profit (Loss) for the year           -289.48   135.76  161.61  -282.60    29.94  163.61
                     Basic earning (loss) per share         -0.47    0.23     0.27    -0.47     0.05    0.27
                     The weighted average number of common shares    447.56  447.56  447.56  447.56  447.56  447.56
                     Net cash flow from (used in) operating activities   -285.39  907.70  878.74  -169.08  908.54  879.28
                     Net cash flow used in investing activities   -319.19  -278.62  -374.68  -257.51  -318.09  -374.69
                     Net cash flow from (used in) financing activities   420.62  -543.35  -560.55  283.55  -586.88  -560.55
                     Net increase (decrease) in cash and cash
                     equivalents                          -183.96    85.73   -56.49  -143.04    3.57   -55.96


                                                               55