
Page 62 - Microsoft Word - One-Report-Eng 2024 Final.docx
P. 62
Tycoons Worldwide Group (Thailand) Plc.
Liabilities
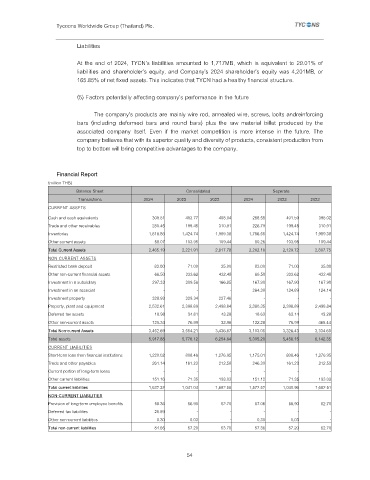
At the end of 2024, TYCN’s liabilities amounted to 1,717MB, which is equivalent to 29.01% of
liabilities and shareholder’s equity, and Company’s 2024 shareholder’s equity was 4,201MB, or
165.85% of net fixed assets. This indicates that TYCN had a healthy financial structure.
(5) Factors potentially affecting company’s performance in the future
The company's products are mainly wire rod, annealed wire, screws, bolts andreinforcing
bars (including deformed bars and round bars) plus the raw material billet produced by the
associated company itself. Even if the market competition is more intense in the future. The
company believes that with its superior quality and diversity of products, consistent production from
top to bottom will bring competitive advantages to the company.
Financial Report
(million THB)
Balance Sheet Consolidated Separate
Transactions 2024 2023 2022 2024 2023 2022
CURRENT ASSETS
Cash and cash equivalents 309.81 493.77 408.04 258.55 401.59 398.02
Trade and other receivables 280.45 199.45 310.91 226.79 199.45 310.91
Inventories 1,816.86 1,424.74 1,989.38 1,756.55 1,424.74 1,989.38
Other current assets 58.07 103.95 109.44 50.26 103.95 109.44
Total Current Assets 2,465.19 2,221.91 2,817.78 2,292.16 2,129.72 2,807.75
NON CURRENT ASSETS
Restricted bank deposit 83.00 71.00 35.00 83.00 71.00 35.00
Other non-current financial assets 66.50 333.62 432.48 66.50 333.62 432.48
Investment in a subsidiary 297.33 309.56 166.85 167.90 167.90 167.90
Investment in an associat - - - 264.39 124.89 124.14
Investment property 328.93 329.34 227.46 - - -
Property, plant and equipment 2,532.61 2,398.89 2,498.84 2,380.35 2,398.89 2,498.84
Deferred tax assets 18.98 34.81 43.28 18.63 63.14 43.28
Other non-current assets 125.34 76.99 32.96 122.28 76.99 465.44
Total Non-current Assets 3,452.69 3,554.21 3,436.87 3,103.05 3,326.43 3,334.60
Total assets 5,917.88 5,776.12 6,254.64 5,395.20 5,456.15 6,142.35
CURRENT LIABILITIES
Short-term loan from financial institutions 1,220.02 808.46 1,276.95 1,175.01 808.46 1,276.95
Trade and other payables 261.14 161.23 212.58 246.39 161.23 212.53
Current portion of long-term loans - - - - - -
Other current liabilities 151.16 71.35 193.03 151.12 71.35 193.03
Total current liabilities 1,632.32 1,041.04 1,682.56 1,572.52 1,040.96 1,682.51
NON-CURRENT LIABILITIES
Provision of long-term employee benefits 58.36 56.90 52.70 57.06 56.90 52.70
Deferred tax liabilities 25.89 - - - - -
Other non-current liabilities 0.30 0.03 - 0.30 0.03 -
Total non-current liabilities 84.55 57.20 53.70 57.36 57.20 52.70
54