
Page 54 - Annual Report English 2018
P. 54
Tycoons Worldwide Group (Thailand) Plc.
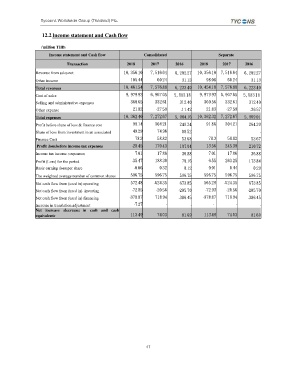
12.2 Income statement and Cash flow
('million THB)
Income statement and Cash flow Consolidated Separate
Transaction 2018 2017 2016 2018 2017 2016
Revenue from sales-net 10,356.10 7,516.64 6,202.27 10,356.10 7,516.64 6,202.27
Other income 105.44 60.24 31.13 98.08 60.24 31.13
Total revenues 10,461.54 7,576.88 6,233.40 10,454.18 7,576.88 6,223.40
Cost of sales 9,979.93 6,967.65 5,683.18 9,979.93 6,967.65 5,683.18
Selling and administrative expenses 360.65 332.61 312.40 360.56 332.61 312.40
Other expense 21.82 -27.59 -11.42 21.83 -27.59 -26.57
Total expenses 10,362.40 7,272.67 5,984.16 10,362.32 7,272.67 5,969.01
Profit before share of loss & finance cost 99.14 304.21 249.24 91.86 304.21 264.39
Share of loss from investment in an associated 49.29 74.96 88.52 - - -
Finance Cost 78.3 5 8 .82 53.68 78.3 5 8 .82 53.67
Profit (loss)before income tax expenses -28.45 170.43 107.04 13.56 245.39 210.72
Income tax income ( expenses) 7.01 17.86 -36.88 7.01 17.86 -36.88
Profit (Loss) for the period -35.47 188.30 70.16 6.55 263.25 173.84
Basic earning (loss) per share -0.06 0.32 0.12 0.01 0.44 0.29
The weighted average number of common shares 596.75 596.75 596.75 596.75 596.75 596.75
Net cash flow from (used in) operating 572.48 -624.35 673.85 565.29 -624.35 673.85
Net cash flow from (used in) investing -72.85 -20.56 -205.70 -72.93 -20.56 -205.70
Net cash flow from (used in) financing -378.87 718.94 -386.45 -378.87 718.94 -386.45
Increase in translation adjustment -7.27 - - - - -
Net increase (decrease) in cash and cash
equivalents 113.49 74.03 81.69 113.49 74.03 81.69
47