
Page 53 - Annual Report English 2018
P. 53
Tycoons Worldwide Group (Thailand) Plc.
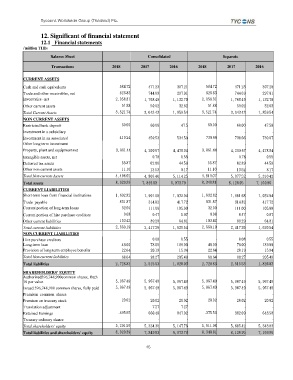
12. Significant of financial statement
12.1 Financial statements
('million THB)
Balance Sheet Consolidated Separate
Transactions 2018 2017 2016 2018 2017 2016
CURRENT ASSETS
Cash and cash equivalents 584.72 471.23 397.21 584.72 471.23 397.20
Trade and other receivables, net 826.83 744.69 297.01 826.83 744.69 297.01
Inventories - net 2,058.31 1,768.49 1,132.70 2,058.31 1,768.49 1,132.70
Other current assets 51.88 59.02 32.62 51.88 59.02 32.63
Total Current Assets 3,521.74 3,043.43 1,859.54 3,521.74 3,043.43 1,859.54
NON CURRENT ASSETS
Restricted bank deposit 60.00 60.00 47.5 60.00 60.00 47.50
Investment in a subsidiary - - - -
Investment in an associated 410.24 459.53 534.50 730.66 730.66 730.67
Other long-term investment - - -
Property, plant and equipment-net 3,961.44 4,209.67 4,478.94 3,961.44 4,209.67 4,478.94
Intangible assets, net 0.78 0.55 0.78 0.55
Deferred tax assets 55.87 62.89 44.59 55.87 62.89 44.59
Other non-current assets 11.10 13.53 8.17 11.10 13.52 8.17
Total Non-current Assets 4,498.65 4,806.40 5,114.25 4,819.07 5,077.52 5,310.42
Total assets 8,020.39 7,849.83 6,973.79 8,340.81 8,120.95 7,169.96
CURRENT LIABILITIES
Short-term loan from financial institutions 1,692.82 1,901.68 1,032.04 1,692.82 1,901.68 1,032.04
Trade payable 831.87 314.82 417.72 831.87 314.82 417.72
Current portion of long-term loans 32.00 111.00 105.00 32.00 111.00 105.00
Current portion of hire purchase creditors 0.08 0.47 0.97 0.08 0.47 0.97
Other current liabilities 103.42 89.29 64.81 103.42 89.29 64.81
Total current liabilities 2,660.19 2,417.26 1,620.54 2,660.19 2,417.26 1,620.54
NON-CURRENT LIABILITIES
Hire purchase creditors - 0.08 0.55 - 0.08 0.55
Long-term loan 46.00 78.00 189.00 46.00 78.00 189.00
Provision of long-term employee benefits 22.64 20.19 15.94 22.64 20.19 15.94
Total Non-current liabilities 68.64 98.27 205.49 68.64 98.27 205.49
Total liabilities 2,728.83 2,515.53 1,826.03 2,728.83 2,515.53 1,826.03
SHAREHOLDERS’ EQUITY
Authorized596,748,900common shares, Bath
10 par value 5,967.49 5,967.49 5,967.49 5,967.49 5,967.49 5,967.49
Issued 596,748,900 common shares, fully paid 5,967.49 5,967.49 5,967.49 5,967.49 5,967.49 5,967.49
Premium common shares - - - -
Premium on treasury stock 20.02 20.02 20.02 20.02 20.02 20.02
Translation adjustment 7.27 7.27 - -
Retained Earnings -695.95 -660.48 -847.02 -375.53 -382.09 -643.58
Treasury ordinary shares - - - -
Total shareholders' equity 5,291.56 5,334.30 5,147.76 5,611.98 5,605.42 5,343.93
Total liabilities and shareholders' equity 8,020.39 7,849.83 6,973.79 8,340.81 8,120.95 7,169.96
46