
Page 76 - Annual Report English 2018
P. 76
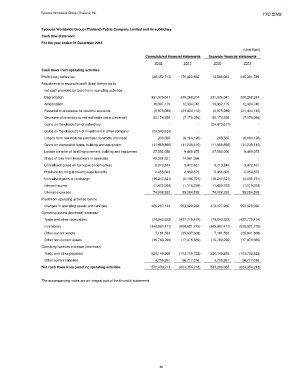
Tycoons Worldwide Group (Thailand) Plc.


                  Tycoons Worldwide Group (Thailand) Public Company Limited and its subsidiary
                  Cash flow statement
                  For the year ended 31 December 2018
                                                                                                       (Unit: Baht)
                                                              Consolidated financial statements  Separate financial statements
                                                                  2018        2017        2018         2017
                  Cash flows from operating activities
                  Profit (loss) before tax                            (28,452,712)        170,429,833           13,566,032         245,391,789
                  Adjustments to reconcile profit (loss) before tax to
                     net cash provided by (paid from) operating activities:
                     Depreciation                                    331,976,041         300,268,314         331,976,041         300,268,314
                     Amortisation                                      18,997,179           12,394,748           18,997,179           12,394,748
                     Reversal of allowance for doubtful accounts            (5,975,089)          (21,434,110)            (5,975,089)          (21,434,110)
                   Decrease of inventory to net realisable value (reversal)           60,174,355            (7,170,094)          60,174,355             (7,170,094)
                     Gains on the dissolution of subsidiary                             -                            -         (24,473,677)                             -
                     Gains on the dissolution of investment in other company          (24,543,634)                           -                             -                            -
                   Losses from raw material purchase contracts (reversal)  208,565  (6,164,126)  208,565  (6,164,126)
                     Gains on disposal of lands, building and equipment           (11,959,892)          (31,238,410)          (11,959,892)          (31,238,410)
                     Losses on write-of land improvement, building and equipment           27,592,056             9,469,975           27,592,056             9,469,975
                     Share of loss from investment in associate          49,291,621            74,961,956                            -                            -
                     Unrealised losses on fair value of derivatives             9,213,844             3,472,461             9,213,844             3,472,461
                     Provision for long-term employee benefits            2,456,603              2,059,878             2,456,603             2,059,878
                     Unrealised gains on exchange                     (16,247,621)           (8,195,791)          (16,247,621)            (8,195,791)
                     Interest income                                    (1,472,504)            (1,119,229)            (1,458,762)            (1,119,229)
                     Interest expenses                                 74,008,332           55,294,525           74,008,332           55,294,525
                  Profit from operating activities before
                     changes in operating assets and liabilities  485,267,144  553,029,930  478,077,966  553,029,930
                  Operating assets (increase) decrease
                     Trade and other receivables                      (79,043,922)       (427,779,474)          (79,043,922)        (427,779,474)
                     Inventories                                    (349,997,471)        (628,621,775)        (349,997,471)        (628,621,775)
                     Other current assets                                7,181,533         (25,937,608)              7,181,533         (25,941,808)
                     Other non-current assets                         (15,783,290)          (17,975,585)          (15,783,290)          (17,975,585)
                  Operating liabilities increase (decrease)
                     Trade and other payables                        520,149,268       (103,786,722)         520,149,268        (103,782,522)
                     Other current liabilities                           4,705,951          26,717,016             4,705,951           26,717,016
                  Net cash flows from (used in) operating activities         572,479,213       (624,354,218)         565,290,035        (624,354,218)


                  The accompanying notes are an integral part of the financial statements.


                                                                    66