Page 69 - Annual Report English 2018
P. 69

Tycoons Worldwide Group (Thailand) Plc.


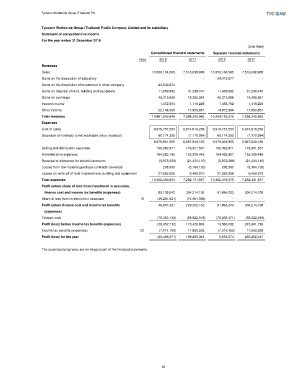
                  Tycoons Worldwide Group (Thailand) Public Company Limited and its subsidiary
                  Statement of comprehensive income
                  For the year ended 31 December 2018
                                                                                                        (Unit: Baht)
                                                                Consolidated financial statements  Separate financial statements
                                                           Note     2018        2017        2018        2017
                  Revenues
                  Sales                                            10,356,104,565       7,516,638,908     10,356,104,565       7,516,638,908
                  Gains on the dissolution of subsidiary                                  -                              -           24,473,677                             -
                  Gains on the dissolution of investment in other company           24,543,634                             -                              -                             -
                  Gains on disposal of land, building and equipment           11,959,892             31,238,410            11,959,892            31,238,410
                  Gains on exchange                                      45,313,686             19,395,561            45,313,686            19,395,561
                  Interest income                                           1,472,504              1,119,229              1,458,762              1,119,229
                  Other income                                           22,148,365             17,953,857            14,872,996            17,953,857
                  Total revenues                                   10,461,542,646       7,586,345,965     10,454,183,578       7,586,345,965
                  Expenses
                  Cost of sales                                     9,919,757,550        6,974,819,259       9,919,757,550       6,974,819,259
                  Decrease of inventory to net realisable value (reversal)           60,174,355              (7,170,094)           60,174,355              (7,170,094)
                                                                    9,979,931,905        6,967,649,165       9,979,931,905       6,967,649,165
                  Selling and distribution expenses                     196,062,971          179,301,507          196,062,971          179,301,507
                  Administrative expenses                               164,583,196          153,309,446          164,498,967          153,309,446
                  Reversal of allowance for doubtful accounts             (5,975,089)            (21,434,110)             (5,975,089)           (21,434,110)
                  Losses from raw material purchase contracts (reversal)                 208,565             (6,164,126)                208,565              (6,164,126)
                  Losses on write-off of land improvement, building and equipment            27,592,056              9,469,975            27,592,056              9,469,975
                  Total expenses                                   10,362,403,604       7,282,131,857     10,362,319,375       7,282,131,857
                  Profit before share of loss from investment in associate,
                     finance cost and income tax benefits (expenses)           99,139,042           304,214,108            91,864,203          304,214,108
                  Share of loss from investment in associate  13          (49,291,621)            (74,961,956)                            -                              -
                  Profit before finance cost and income tax benefits            49,847,421           229,252,152            91,864,203          304,214,108
                     (expenses)
                  Finance cost                                           (78,300,133)           (58,822,319)           (78,298,171)           (58,822,319)
                  Profit (loss) before income tax benefits (expenses)          (28,452,712)          170,429,833             13,566,032          245,391,789
                  Income tax benefits (expenses)            22             (7,014,159)           17,860,528              (7,014,159)           17,860,528
                  Profit (loss) for the year                            (35,466,871)          188,290,361               6,551,873          263,252,317


                  The accompanying notes are an integral part of the financial statements.


                                                                     62
   64   65   66   67   68   69   70   71   72   73   74