Page 66 - Annual Report English 2018
P. 66

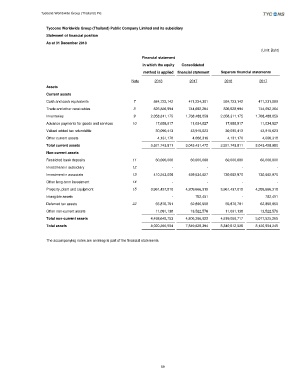
Tycoons Worldwide Group (Thailand) Plc.


                    Tycoons Worldwide Group (Thailand) Public Company Limited and its subsidiary
                    Statement of financial position
                    As at 31 December 2018
                                                                                                              (Unit: Baht)
                                                            Financial statement
                                                             in which the equity  Consolidated
                                                             method is applied  financial statement  Separate financial statements

                                                        Note      2018          2017           2018          2017
                    Assets
                    Current assets
                    Cash and cash equivalents            7              584,723,142               471,234,381              584,723,142              471,231,889
                    Trade and other receivables          8              826,828,994               744,692,264              826,828,994              744,692,264
                    Inventories                          9           2,058,311,175            1,768,488,059           2,058,311,175           1,768,488,059
                    Advance payments for goods and services   10               17,658,917                 11,034,827                17,658,917                11,034,827
                    Valued added tax refundable                           30,090,413                 43,915,623                30,090,413                43,915,623
                    Other current assets                                    4,131,170                   4,066,318                  4,131,170                  4,066,318
                    Total current assets                             3,521,743,811            3,043,431,472           3,521,743,811           3,043,428,980
                    Non-current assets
                    Restricted bank deposits            11                60,000,000                 60,000,000                60,000,000                60,000,000
                    Investment in subsidiary            12                                 -                                  -                                 -                                 -
                    Investment in associate             13              410,243,006               459,534,627              730,662,970              730,662,970
                    Other long-term investment          14                                 -                                  -                                 -                                 -
                    Property, plant and equipment       15           3,961,437,818            4,209,666,318           3,961,437,818           4,209,666,318
                    Intangible assets                                                      -                      782,451                                -                      782,451
                    Deferred tax assets                 22                55,876,791                 62,890,950                55,876,791                62,890,950
                    Other non-current assets                              11,091,138                 13,522,576                11,091,138                13,522,576
                    Total non-current assets                         4,498,648,753            4,806,396,922           4,819,068,717           5,077,525,265
                    Total assets                                     8,020,392,564            7,849,828,394           8,340,812,528           8,120,954,245


                    The accompanying notes are an integral part of the financial statements.


                                                                    59
   61   62   63   64   65   66   67   68   69   70   71