
Page 116 - Microsoft Word - One-Report-Eng 2024 Final.docx
P. 116
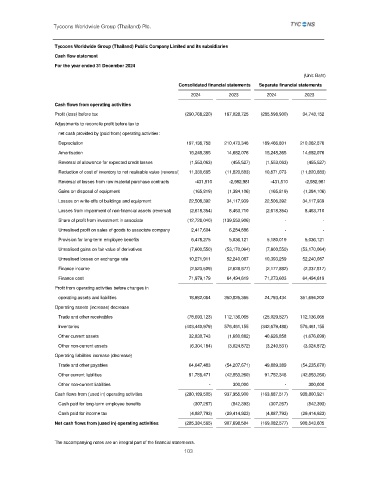
Tycoons Worldwide Group (Thailand) Plc.


                   Tycoons Worldwide Group (Thailand) Public Company Limited and its subsidiaries

                   Cash flow statement

                   For the year ended 31 December 2024

                                                                                                      (Unit: Baht)

                                                            Consolidated financial statements  Separate financial statements
                                                                 2024        2023        2024         2023
                   Cash flows from operating activities

                   Profit (loss) before tax                       (290,768,220)        167,028,725       (285,598,900)          34,748,152

                   Adjustments to reconcile profit before tax to

                      net cash provided by (paid from) operating activities:

                      Depreciation                                 197,138,758        210,473,346        189,466,801        210,062,876

                      Amortisation                                     15,248,365          14,682,076          15,248,365          14,682,076

                      Reversal of allowance for expected credit losses          (1,553,063)              (455,527)           (1,553,063)              (455,527)


                      Reduction of cost of inventory to net realisable value (reversal)         11,330,665         (11,820,883)          10,871,073         (11,820,883)

                      Reversal of losses from raw material purchase contracts  -431,510  -2,982,981  -431,510  -2,982,981
                      Gains on disposal of equipment                   (165,819)               (1,384,106)              (165,819)           (1,384,106)

                      Losses on write-offs of buildings and equipment          22,506,392          34,117,939          22,506,392          34,117,939


                      Losses from impairment of non-financial assets (reversal)          (2,618,354)            8,463,710           (2,618,354)            8,463,710

                      Share of profit from investment in associate         (12,728,040)       (139,553,906)                            -                           -

                      Unrealised profit on sales of goods to associate company            2,417,604            6,284,886                            -                           -


                      Provision for long-term employee benefits            6,478,275            5,036,121            5,180,019            5,036,121
                      Unrealised gains on fair value of derivatives            (7,600,550)          (53,170,064)           (7,600,550)         (53,170,064)
                      Unrealised losses on exchange rate               10,271,911          52,240,087          10,393,259          52,240,087
                      Finance income                                   (2,523,509)            (2,628,677)           (2,177,882)           (2,337,817)

                      Finance cost                                   71,979,179          64,494,619          71,273,603          64,494,619

                   Profit from operating activities before changes in

                      operating assets and liabilities                 18,982,084        350,825,365          24,793,434        351,694,202

                   Operating assets (increase) decrease

                      Trade and other receivables                   (78,693,123)        112,136,065         (25,029,527)        112,136,065

                      Inventories                                 (403,440,979)        576,461,155       (342,679,488)        576,461,155
                      Other current assets                             32,830,743           (1,680,882)          40,626,858            (1,676,699)

                      Other non-current assets                         (6,304,184)           (3,024,872)           (3,240,531)           (3,024,872)

                   Operating liabilities increase (decrease)

                      Trade and other payables                       64,647,483         (54,207,671)          49,889,389         (54,235,670)

                      Other current liabilities                        91,788,471         (42,853,260)          91,752,348         (42,853,260)

                      Other non-current liabilities                                   -               300,000                           -               300,000

                   Cash flows from (used in) operating activities       (280,189,505)        937,955,900       (163,887,517)        938,800,921
                                                                 (307,267)
                      Cash paid for long-term employee benefits                         (842,393)              (307,267)              (842,393)
                      Cash paid for income tax                         (4,887,793)         (29,414,923)           (4,887,793)         (29,414,923)

                   Net cash flows from (used in) operating activities       (285,384,565)        907,698,584       (169,082,577)        908,543,605


                   The accompanying notes are an integral part of the financial statements.
                                                              103