
Page 110 - Microsoft Word - One-Report-Eng 2024 Final.docx
P. 110
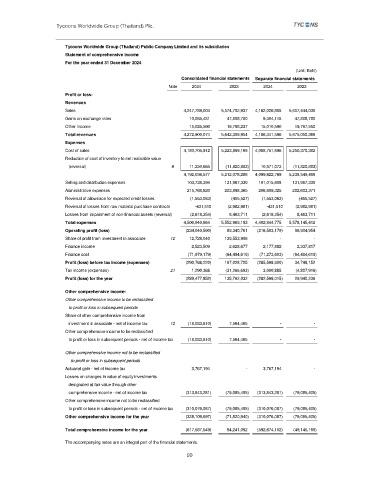
Tycoons Worldwide Group (Thailand) Plc.


                       Tycoons Worldwide Group (Thailand) Public Company Limited and its subsidiaries
                       Statement of comprehensive income
                       For the year ended 31 December 2024
                                                                                                   (Unit: Baht)
                                                             Consolidated financial statements  Separate financial statements
                                                         Note    2024        2023       2024       2023
                       Profit or loss:
                       Revenues
                       Sales                                  4,247,789,003  5,574,702,937  4,162,026,888    5,607,444,036

                       Gains on exchange rates                      10,085,481         47,808,780           9,304,118         47,808,780

                       Other income                                 15,025,590         19,798,237         15,010,590         19,797,550
                                                                                     4,186,341,596

                                                                                                 5,675,050,366
                                                                          5,642,309,954
                                                              4,272,900,074
                       Total revenues
                       Expenses
                       Cost of sales                          4,180,705,912  5,223,899,169  4,088,751,696    5,250,370,382
                       Reduction of cost of inventory to net realisable value
                          (reversal)                      9           11,330,665        (11,820,883)         10,871,073        (11,820,883)
                                                              4,192,036,577  5,212,078,286  4,099,622,769    5,238,549,499
                       Selling and distribution expenses           103,738,394       131,967,339       101,015,608       131,967,339
                       Administrative expenses                     215,768,620       203,898,365       206,809,325       202,603,371
                       Reversal of allownace for expected credit losses          (1,553,063)             (455,527)          (1,553,063)              (455,527)
                       Reversal of losses from raw material purchase contracts  -431,510         (2,982,981)  -431,510          (2,982,981)

                       Losses from impairment of non-financial assets (reversal)          (2,618,354)           8,463,711          (2,618,354)           8,463,711

                       Total expenses                         4,506,940,664  5,552,969,193  4,402,844,775  5,578,145,412
                       Operating profit (loss)                     (234,040,590)         89,340,761      (216,503,179)          96,904,954
                       Share of profit from investment in associate  12          12,728,040       139,553,906                           -                          -
                       Finance income                                   2,523,509           2,628,677           2,177,882           2,337,817
                                                                            (64,494,619)
                                                               (71,979,179)

                       Finance cost                                (290,768,220)        167,028,725        (71,273,603)        (64,494,619)

                                                                                      (285,598,900)


                                                                                                   34,748,152


                       Profit (loss) before tax income (expenses)  21            1,290,368        (31,266,693)           3,000,885          (4,807,916)
                       Tax income (expenses)
                       Profit (loss) for the year                (289,477,852)       135,762,032      (282,598,015)          29,940,236


                       Other comprehensive income:
                       Other comprehensive income to be reclassified
                          to profit or loss in subsequent periods
                       Share of other comprehensive income from
                          investment in associate - net of income tax  12         (18,033,610)           7,564,465                         -                            -
                       Other comprehensive income to be reclassified
                          to profit or loss in subsequent periods - net of income tax         (18,033,610)           7,564,465                         -                            -
                       Other comprehensive income not to be reclassified
                            to profit or loss in subsequent periods
                       Actuarial gain - net of income tax             3,767,194                          -           3,767,194                         -

                       Losses on changes in value of equity investments
                          designated at fair value through other

                          comprehensive income - net of income tax       (313,843,281)         (79,085,405)      (313,843,281)       (79,085,405)
                       Other comprehensive income not to be reclassified
                          to profit or loss in subsequent periods - net of income tax       (310,076,087)         (79,085,405)      (310,076,087)         (79,085,405)

                       Other comprehensive income for the year       (328,109,697)         (71,520,940)      (310,076,087)       (79,085,405)
                       Total comprehensive income for the year     (617,587,549)         64,241,092      (592,674,102)       (49,145,169)


                       The accompanying notes are an integral part of the financial statements.
                                                               99